Inland floods are becoming more prevalent all over Canada. As floods are increasing in frequency and intensity due to climate change, the economic losses and public safety concerns caused by them pose a threat to the well-being of the communities (see the Government of Canada's website for more information). Three primary factors are causing an increased flood risk:
- Deforestation and urbanization
- Development in flood-prone areas
- Infrastructure not adapted to climate change
Understanding flood risks is important for planning purposes. Plan360 is using mapping techniques to delineate flood hazard areas and identify the assets at risk in the region. Such maps provide public awareness and decision support in the land use planning process.
The Blue Zone Report
The “Planning the Blue Zone” report outlines the need to better map inland flooding in the southeast region. It makes an argument for recognizing the value of natural assets in its planning practices for freshwater flooding adaptation and mitigation. The Blue Zone report is the first step in a series of measures that will influence land use planning at the local and regional levels.
The challenges of mapping inland flooding
Inland flood mapping is a challenging task as the extents depend on many factors such as the type of land cover, the degree and timing of precipitation and topography. Technical expertise and high-quality data are essential in generating accurate maps. Plan360 has been working in partnership with the Université de Moncton to apply and develop tools that consider the effects of climate change in the mapping process.
Results
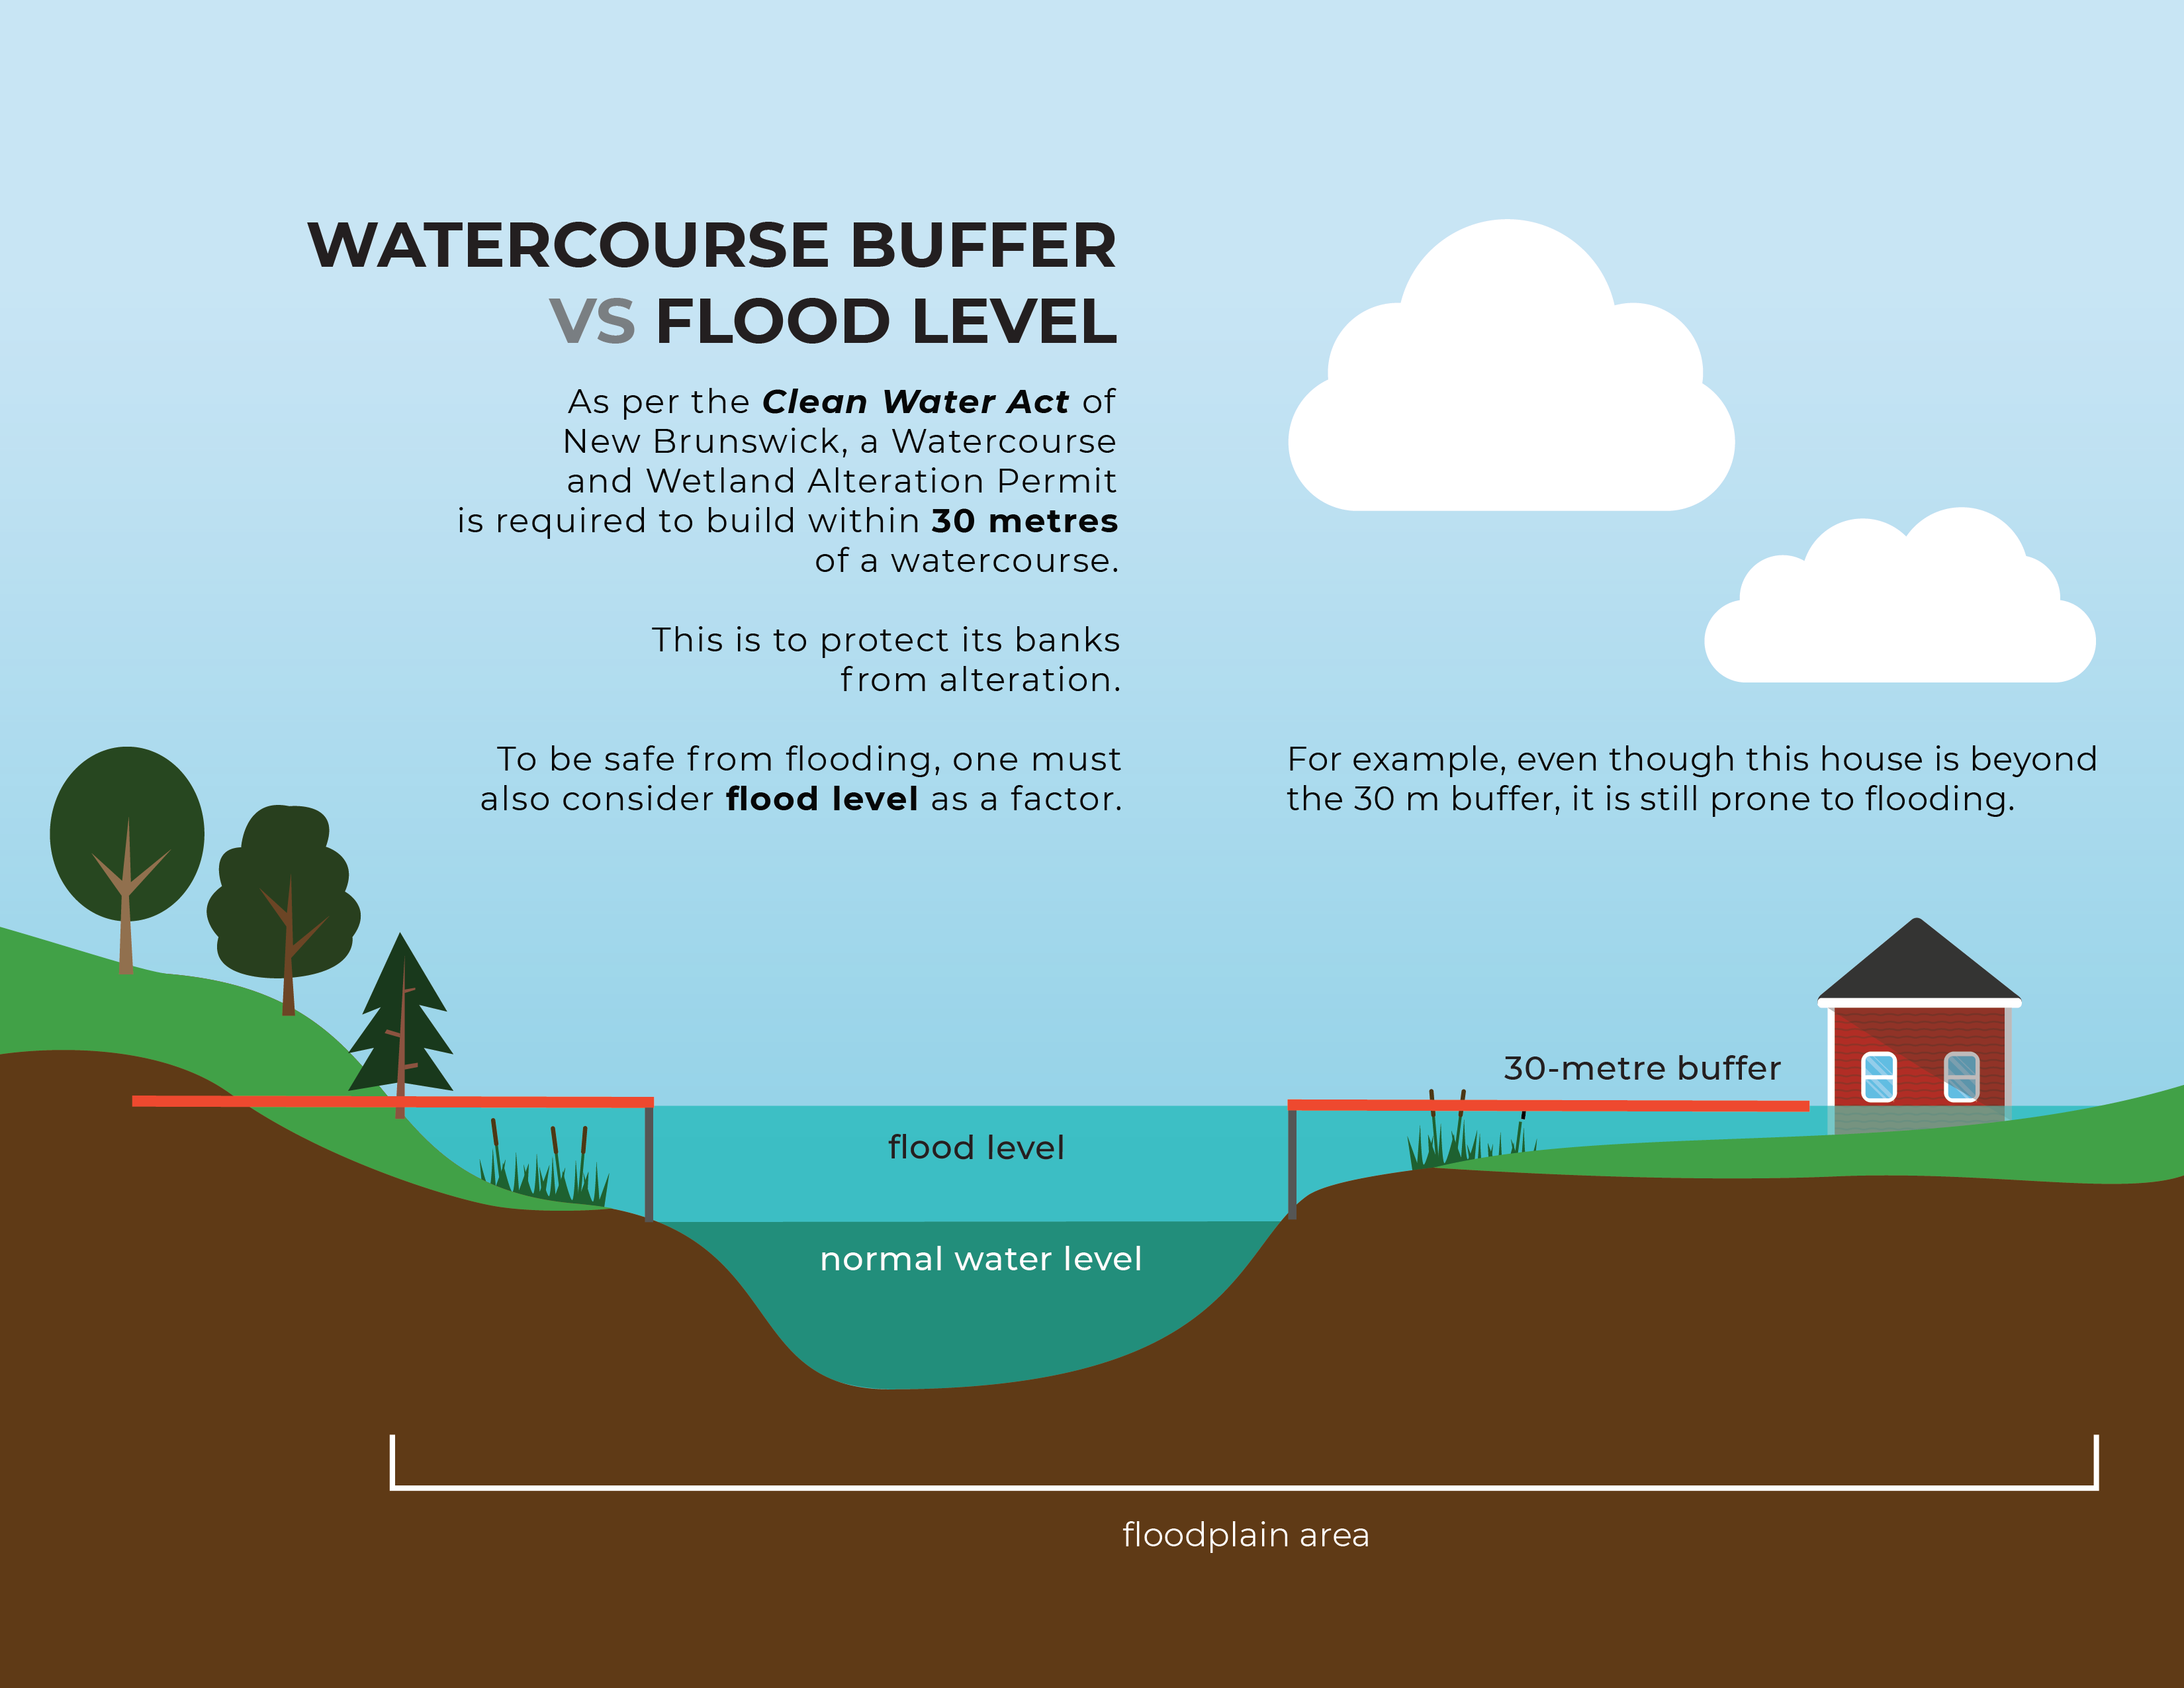
There are currently no regulations in place to address development in flood-prone areas. The existing Clean Water Act only imposes a watercourse buffer to protect water resources. This does not guarantee a building is safe from flooding, as explained in the infographic below (figure 1).


